Summary
In this lab students studied the process of osmosis by observing red onion cells in different solutions. Osmosis is the diffusion of water, meaning that water goes from a high concentration to a lower concentration of water molecules.
To observe onion cells, scholars peeled off red skin from onion chunks and placed them over a drop of water on a microscope slide. A cover slip was then placed over the onion cells, starting at a 45 degree angle in order to avoid air bubbles.
Scholars made initial observations of the cell wall, cell membrane, and cytoplasm of one onion cell.

Figure 1. First Observation: one drop of distilled water
Next, several drops of 10% salt solution was added to the side of the cover slip spread into the onion cells. Observations of the same cell were made again. Scholars noticed a smaller, shrinking cytoplasm.
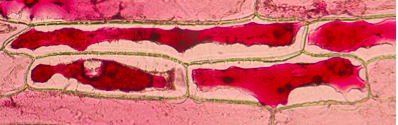
Figure 2. Second Observation: 10% salt solution
In the last step, scholars reintroduced distilled water into the cell, once again expanding the cytoplasm in the cell.
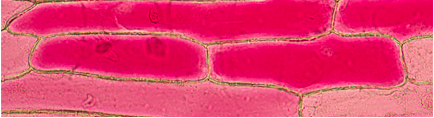
Figure 3. Third Observation: Addition of more Distilled Water
Summary
In this lab students experimented with the diffusion of certain molecules through an artificial cell membrane. The artificial cell membrane was made of a very thin tubing with small pores that allowed very small molecules to pass through. The tube was filled with starch and glucose then closed. This tubing was then placed in a beaker of water for an hour. Also during this time 10 drops of starch indicator ( Iodine) was added to the liquid surrounding the tubing, creating an amber color. So to recap:
Inside the Cell
-Starch
-Glucose
Outside the Cell
-starch indicator
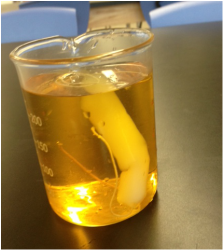
Figure 1. Initial State of Experiment
While we waited I explained indicators. Indicators tell us if a specific molecule is in the liquid by changing the color of the liquid. For example the starch indicator indicates if there are starch molecules in a liquid by changing from amber to black when in the presence of starch. A glucose indicator normally changes from its normal blue color to a red color when in the presence of glucose.
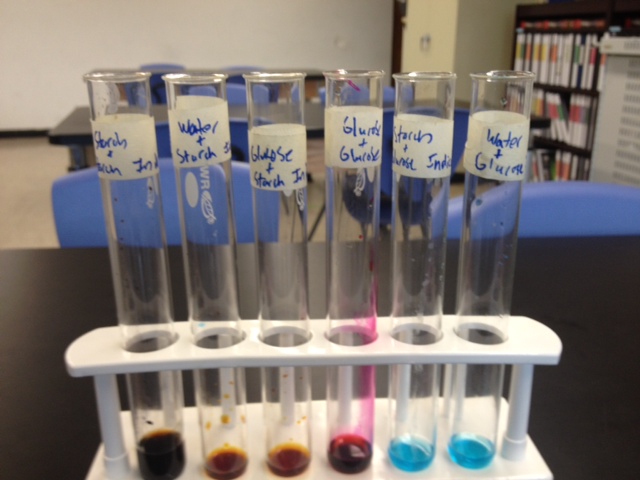
Figure 2. Indicators mixed with water, starch, or glucose
After one hour the tubing had become black. This is because the starch indicator had diffused to an overall lower concentration by moving into our artificial cell. Inside the cell it mixed with the starch to create a black color. We then tested the water outside of the tubing with a glucose indicator. The liquid turned red, indicating that glucose did escape from the cell. But did starch?
Figure 3. Final State of Experiment
Essential Question: How can we calculate the number of calories in the food we eat and make better dietary decisions using this data?
Lesson Summary: In a two day lab students experimented with marshmallows, cheese doodles, goldfish, popcorn, and potato chips to find the number of calories in each food type.
To measure the number of calories students recorded the change in temperature of the water in the calorimeter and the change in mass of the burned food. Scholars then used this data to calculate an estimate of kilocalories per gram for each food.
Challenge Question: How can we have as much fun in one hour and learn about science at the same time?
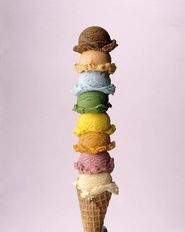
Lesson Summary: Today as the 10th graders took there PSAT the 9th grade experimented with homemade ice cream and mini-airzookas.
Homemade Ice Ceam
First we learned the properties of water and how when salt is added to ice the freezing point is lowered, making everything in an enclosed space colder. This allowed us to produce homemade vanilla ice cream by using two ziploc bags, one small and one large. The small ziploc bag was filled with all the ingredients necessary for delicious ice cream:
Mr. Keil's Family Recipe
-1 cup cream
-2 tbsp sugar
-1/2 tbsp vanilla extract
This small ziploc bag was then placed inside a bag full of ice and kosher salt. Scholars proceeded to shake these bags to the tunes of Outkast for 10 minutes until the cream became solid. Then Bon Appetit!
Mini-Airzookas
For the second half of class we learned about the science of air vortexes by constructing mini-airzookas. Mr. Keil also demoed as enormous airzooka made from a shower curtain, garbage bin, and bungee cords.
After our airzookas were finished scholars used a fog machine to visualize the vortex rings flying out.
Essential Question: How can we investigate for the existence of bacteria, parasites, and other microorganisms in our water?
Lesson Summary: Students learned the art of observation and first practiced this new skill on a set of videos of pond microorganisms. Next students used microscopes to observe microorganisms in pond water from Central Park. Using a digital microscope we were able to capture some of the creatures we found. Let's just say I don't think any AMS scholars or faculty will be swimming in ponds anytime soon after this lab.
Essential Question: How can we determine if water is too contaminated to drink?
Lesson Summary:
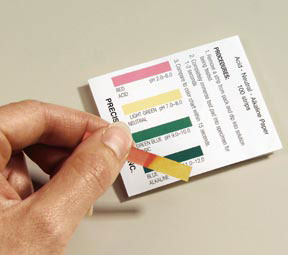
In part 1 of the laboratory procedure we tested the pH( a measure of acidity) for eight different beverages. The lower the pH the more acidic the substance. The higher the pH, the more basic a substance is. The scale ranges from 1 to 14, with 7 being neutral. Students found neutral pHs for water fountain water, milk, fiji, and poland spring. Coke and vitamin water were highly acidic and possibly dangerous and could possibly lead to health problems by disrupting pH homeostasis in the body.
For part 2 each lab group used a water testing kit to record levels of copper, iron, chlorine, nitrogen, and hardness in the water. The class concluded that the low level of contaminants in the water fountain water was safe enough to drink. Alternatively, the high levels of nitrogen in the compost water was dangerous to consume.
 RSS Feed