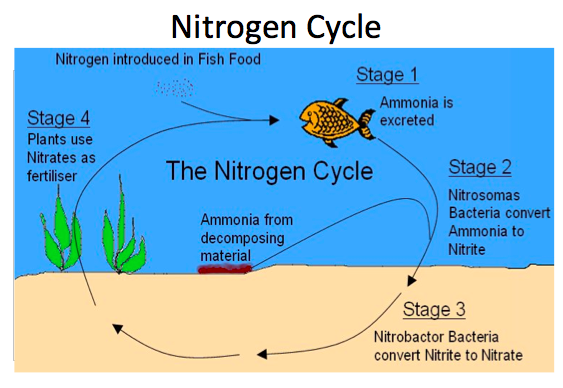
Summary: In this experiment students tested their ecosystem water for dangerous chemicals, temperature, and water microorganisms. The goal was to see if the nitrogen cycle was functioning properly in each group's aquatic ecosystem.
Background:
Data Collected:
Station 1
pH: 6.5
Station 2
0 ppm
Station 3
30 ppm
Station 4
22 C
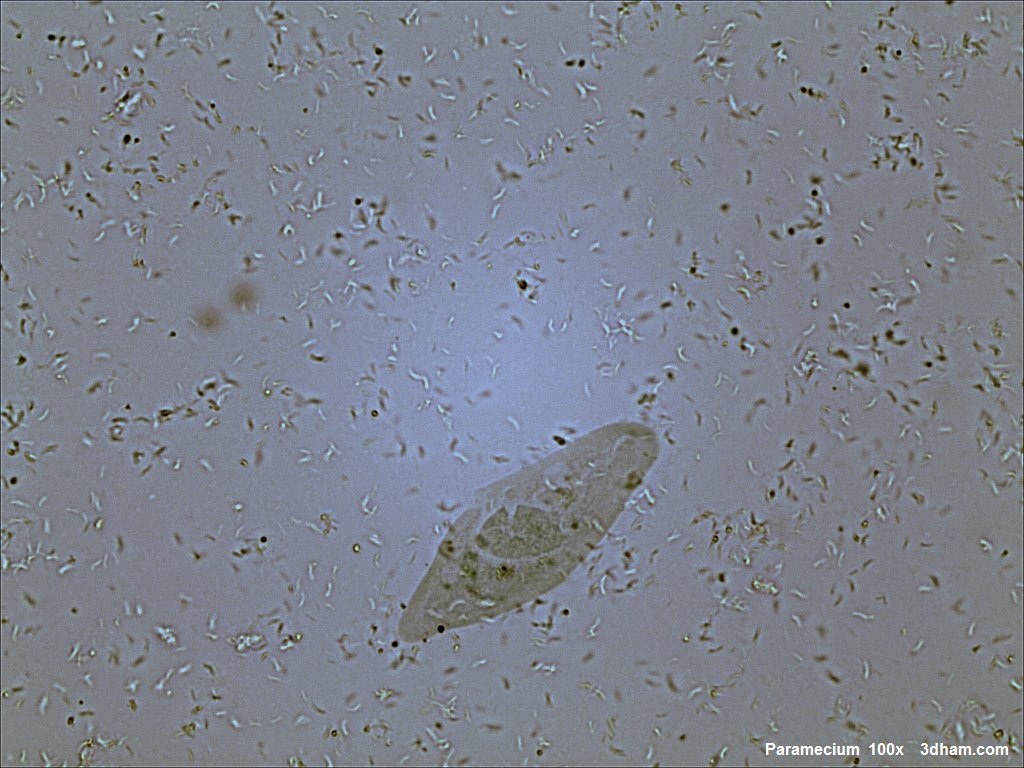
Station 5
Under the microscope you see small bacteria as well as some parameciums.
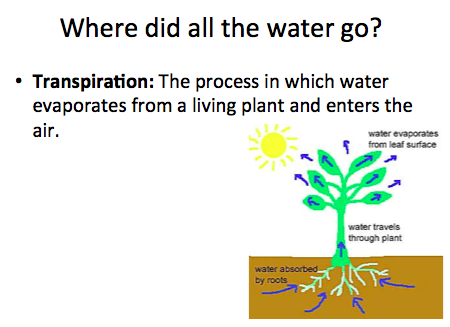
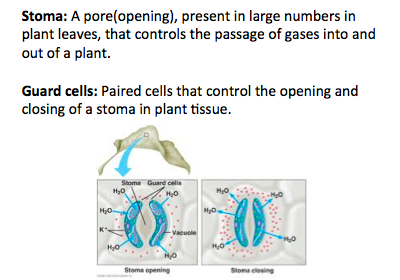
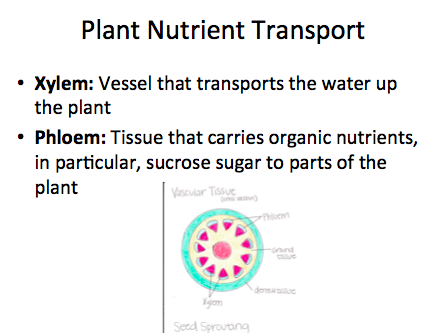
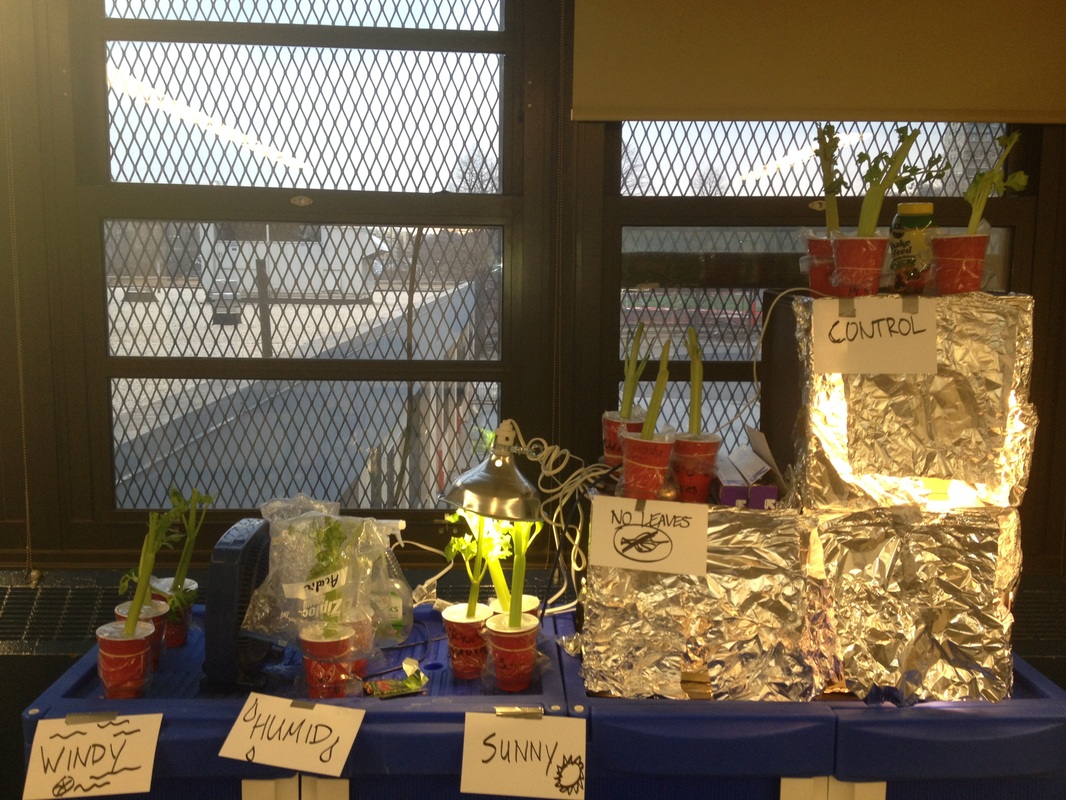
Summary: In this lab students returned to their celery plants after 8 days to measure how much water was absorbed, and learn the plant structures that transport the water/nutrients, and the structures that allow for water and carbon dioxide to be exchanged.
Background terms and research:
Powerpoint slides from class
Data:
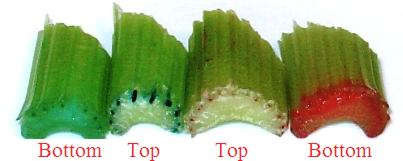
Figure 1: Cross section of Celery
Figure 2: Cross section of plant under microscope
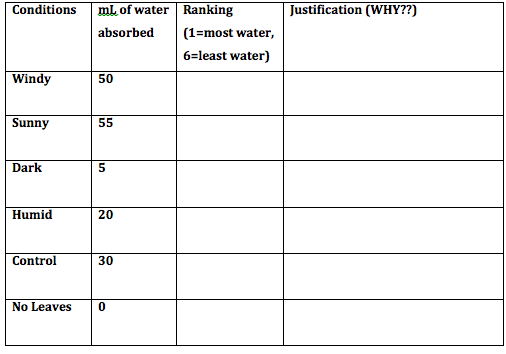
Summary: In this experiment students placed celery into cups containing water and food coloring. Each group then put their celery stick in a different condition(either sunny, windy, no leaves, humid, control, or dark). Students then made predictions on which condition would make the celery plant absorb the most water over 8 days.
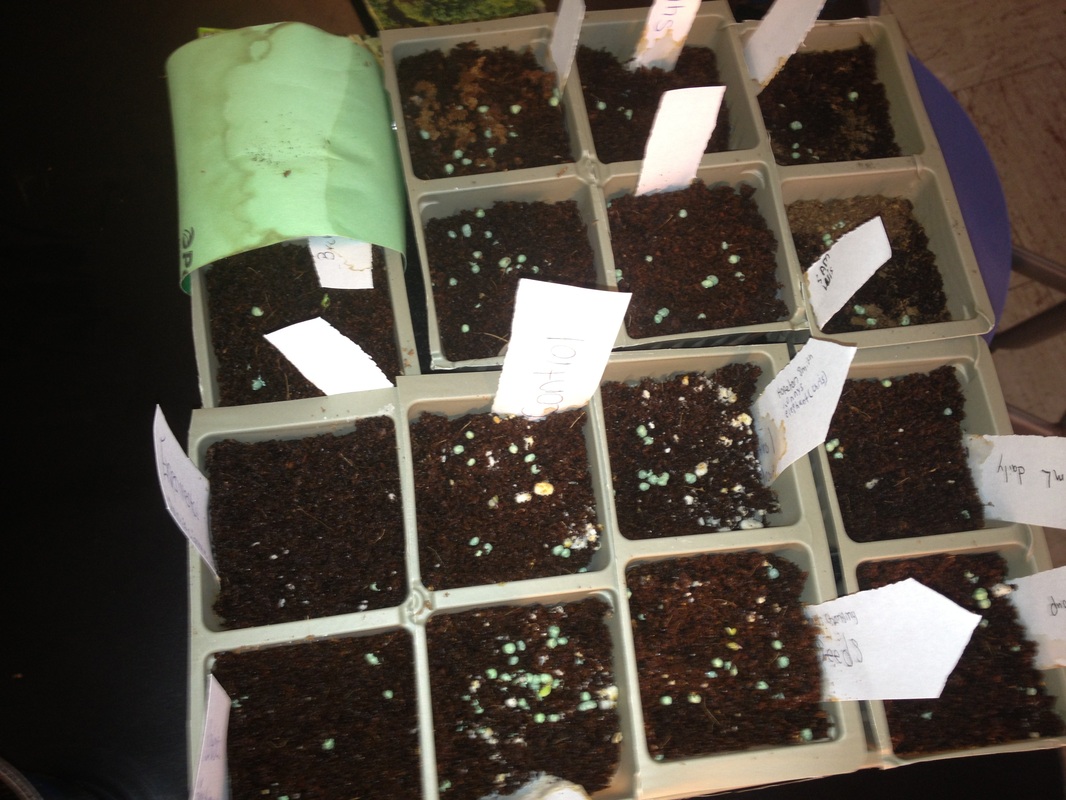
Summary: In this lab scholars setup their fast plant experiment. Students decided one biotic or abiotic factor they wanted to manipulate and then studied the fast plants growth over several days.
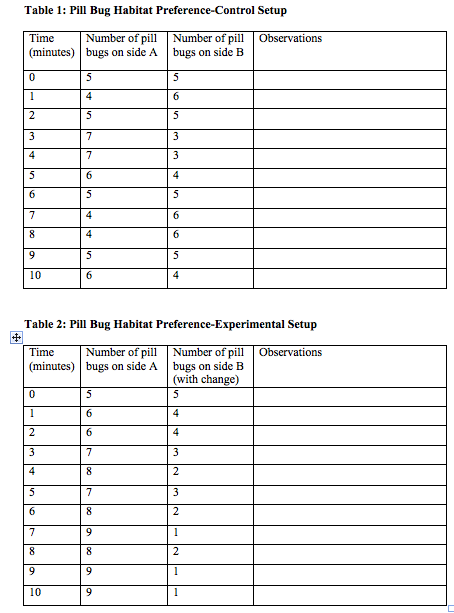
Summary: In this lab students studied the different habitat preferences of pill bugs. To do this students received 2 petri dishes, with a pathway connecting them for pillbugs to cross.
Each group chose one habitat experiment from the list below. Students then changed one of the petri dishes by adding that condition. Students then counted the number of pillbugs on either side every minute for 10 minutes. After graphing the data, we then attempted as a class to find the ideal environmental conditions for the pillbug.
Data:
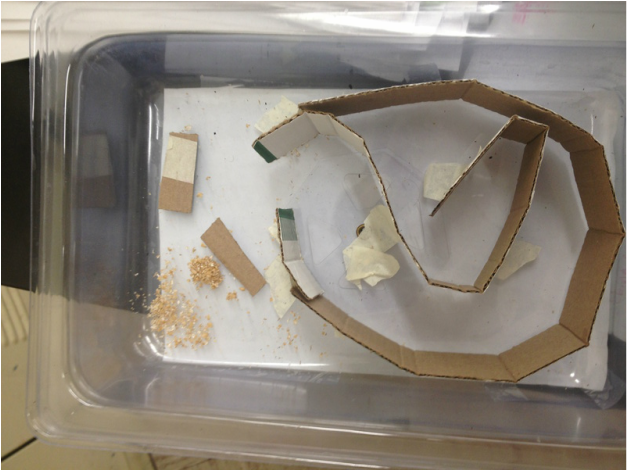
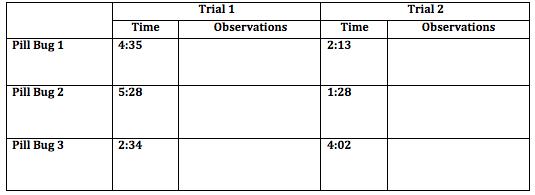
Summary: In this experiment students tested pillbug memory by constructing different mazes, with a start and finish(with food). Students placed three pillbugs at the start of the maze and timed how long it took the pillbug to reach the finish. After the first trial the pillbugs were timed once more to see fi they could remember the route.
Your Data:
Below are the times for your pillbugs. You must try and make your own observations if possible.
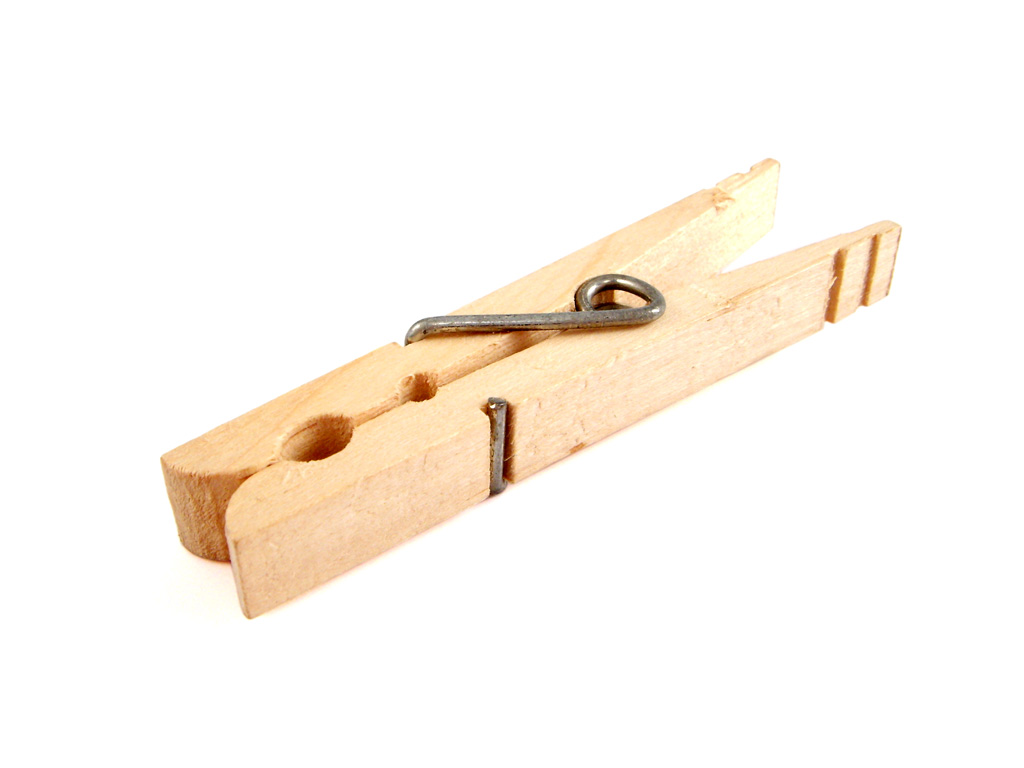
Summary: In this lab students first tested their pulse. Then we made a histogram of the classes pulse. In the second part of the lab students studied fatigue by squeezing a clothespin as many times as they could in a minute. Resting, then squeezing for another minute. Did their numbers go up? Finally in the third part, students designed their own experiment to test whether exercising before squeezing the clothespin helps or hurts the number of squeezes in a minute.
Data:
Class Average Pulse Rates: 67, 89, 82, 84, 77, 78, 85, 85, 93, 91, 92, 92, 91, 90, 90, 73, 110, 47
For when you design your own experiment you must make up your own data(the number of squeezes for each test subject) for what might have happened.
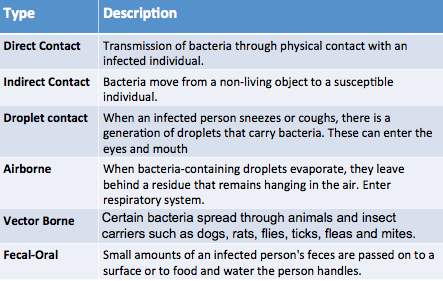
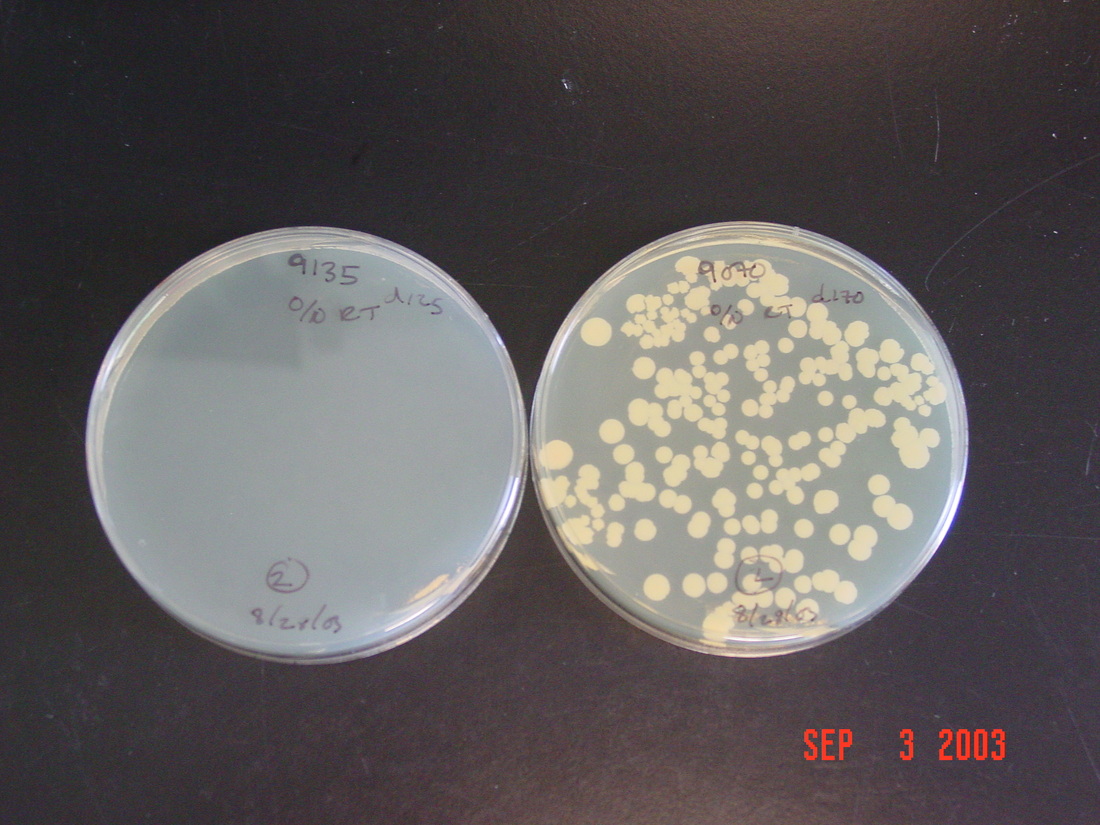
Summary: In this lab Scholars investigated types of bacteria in the school by swabbing different spaces throughout AMS. Scholars then cultured bacterial plates and count the number of bacteria colonies in each location swabbed. Using this data scholars then made conclusion about which areas they swabbed was dirtier.
Background Research:
Data:
Assuming that you decided to swab two plates here are the hypothetical results of your experiment:
Suggestions for Improvement Notes:
Human Errors: Possible errors in your experiment made by people conducting the experiment.
Systematic Errors: Possible errors in the equipment and lab instruments.
Random Error: Something unpredictable like a change in temperature or an earthquake, etc.
 RSS Feed